
For troubleshooting purposes, sometimes you may need to check your website’s logs to get more information about why that problem occurred.
So in this article, I will explain how to view error and access logs of your website via cPanel when you have shared or reseller hosting plan.
Simply, your website logs are saved when your site is visited by someone. The server receives a request from the website visitor’s browser and location to your server. So when visitors visit the website, all activities are logged in the website access logs folder.
Access logs
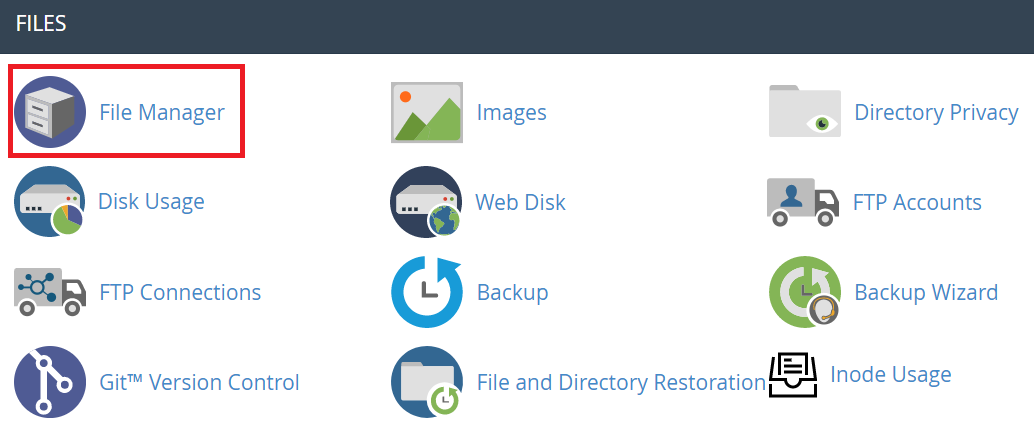
Log in to your cPanel account and navigate to Metrics > File Manager and open logs folder. Here you will find logs of your websites that are hosted in this hosting package. You can download these files to your device and then view them.
Log example and explanation:
100.7.777.77 - - [08/Sep/2020:12:17:42 -0600] "GET / HTTP/1.1" 200 43 "-" "Mozilla/5.0 (Linux; Android 10; SM-A205F Build/KOT49H) AppleWebKit/537.36 (KHTML, like Gecko) Version/4.0 Chrome/30.0.0.0 Mobile Safari/537.36"
100.7.777.77 – the IP address of the visitor which visited the website;
‘- -‘ – represent the two different ways of determining the identity of the requester. The first one, identd, is unreliable and usually shown as a dash which means unknown. The second one will be replaced with a username if HTTP Authentication is used. In the provided example, these two are unknown and that’s why they appear as two dashes.
[08/Sep/2020:12:17:42 -0600] – the date and time with universal time offse;
GET – the type of HTTP request sent by the visitor (usually GET or POST);
/ HTTP/1.1 – a relative path to a file/image/query and HTTP version (1.1 in the example)
200 – the request code that the server has returned. 200 means success.
43 – the size of the file in bytes, not including any headers;
“-“ – the site that referred the user. “-” means that the user entered the URL into the address bar by hand; “Mozilla/5.0 (Linux; Android 10; SM-A205F Build/KOT49H) AppleWebKit/537.36 (KHTML, like Gecko) Version/4.0 Chrome/30.0.0.0 Mobile Safari/537.36”: the identity string of the browser from which is making the request.
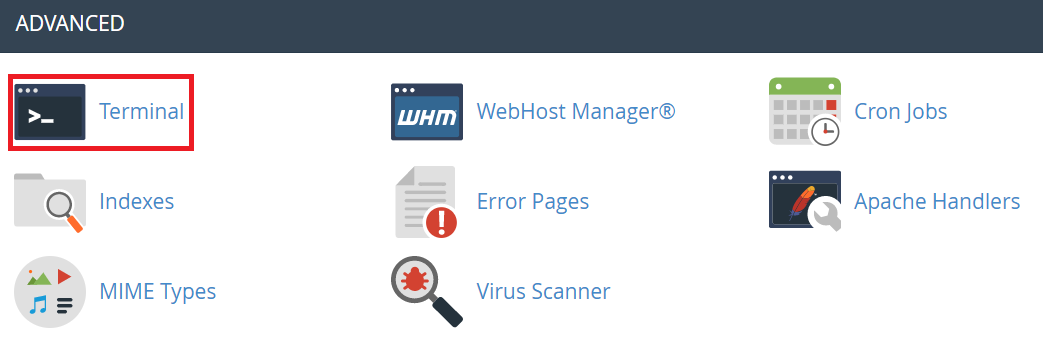
Website logs can be checked via cPanel’s terminal. Log in to your cPanel account and navigate to Advanced> Terminal.
The folder path is:
/var/home/username/access-logs.
Instead of username, you should use your shared hosting package username or reseller’s package account username.
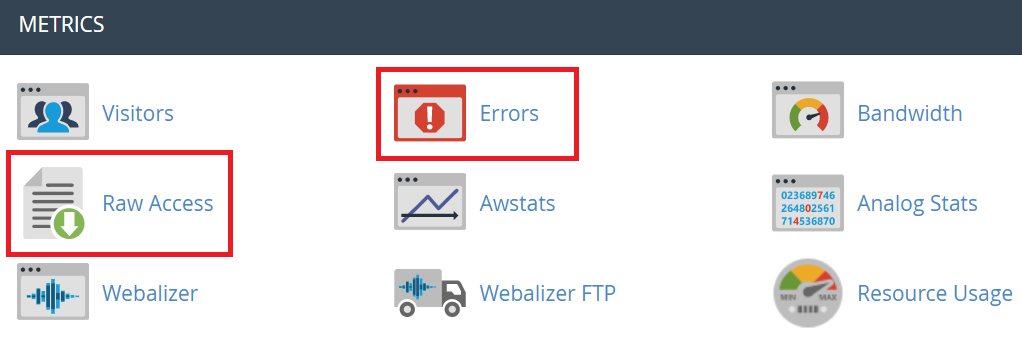
Also, website logs can be checked via Raw Access. Log in to your cPanel account and navigate to Metrics > Raw Access.
Here you can download your website latest logs. This is really helpful when you want to see the traffic to your website and who has accessed your site recently when these logs are not saved yet in the website logs file which you would check via File Manager or terminal.
Error logs
If visitors hit the section of the website and they cause an error, this error log will log the date and time, IP address of the visitor, the location of where the error is occurring and the domain it is referring to. All this information will be saved in the error file.
cPanel comes with an error log section that allows you to view errors generated by your site. Log in to your cPanel account and navigate to Metrics > Errors. Here you will find the last errors of your website. This can be very helpful for finding problems with missing files or broken links of your website.
Also, error logs are saved in your website files, so you can view them by navigating to cPanel > File Manager, open your website folder (for example, public_html) and look for error_log file.
Error example:
[Mon Sep 07 11:07:47 2020] [error] [18000] [client 100.7.777.77:7777] File not found [/var/home/username/public_html/400.shtml]
Mon Sep 07 11:07:47 2020 – date and time when it happened;
[18000] – process ID;
[client 100.7.777.77:7777] – the IP address of the client that made the request which resulted in the message we’re looking at now. The IP will be followed by the port number that they connected through;
File not found /var/home/username/public_html/400.shtml – the location of the error.