
Shared hosting resource monitoring can help you in many ways to determine the issue and find out if a certain situation is caused by a network issue, website performance issue, or just a lack of resources. Hostens provide cPanel-based shared hosting packages, that have a few tools to monitor the resources implemented.
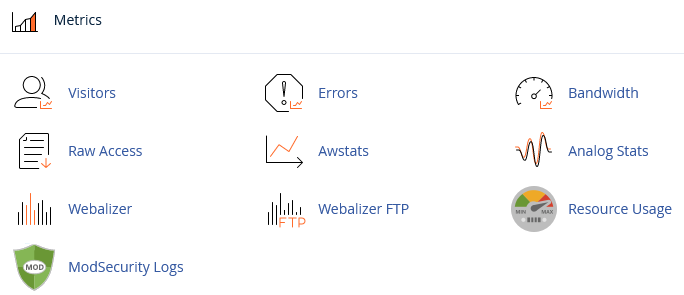
A regular cPanel account has a “Resource usage” option, which can provide some insights on how is your account’s resources being used. This menu can be found in the cPanel > Metrics section.
This feature instantly shows if your whole account had any resource issues past 24 hours. Below are two examples:
The good version:
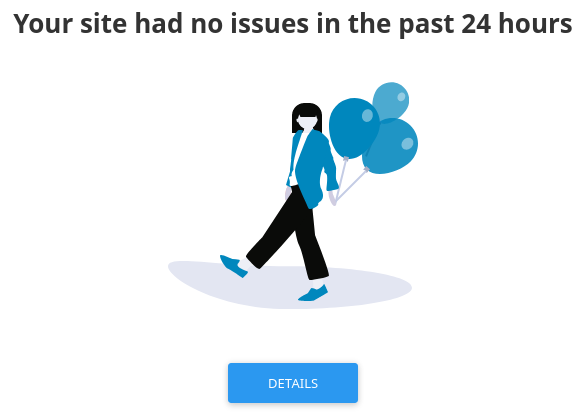
So this response is very simple, during the past 24 hours there were no issues with resource usage or exceeding them, which may instantly point you to look for the issue elsewhere and don’t waste time on the server-side in most cases.
The bad version:
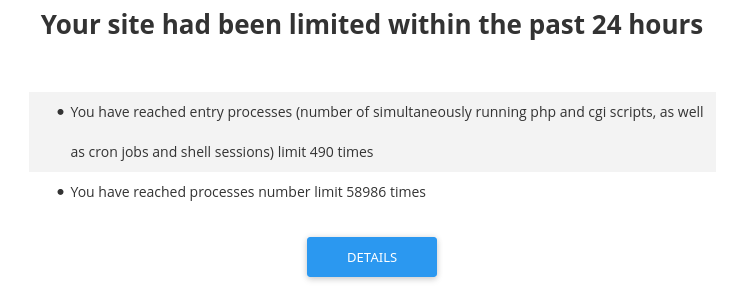
This bad version example shows information about your resources exceeding the package limits during the past 24 hours. This specific example shows your account has exceeded two limits: Entry Processes and Number of Processes.
- Entry Processes is every single process that is related to your website. When a user enters the website or does anything on it, it is an entry process.
- Number of Processes is all of your processes on the account. It includes the Entry Processes in this as well, but it also includes all the other processes on your account, like cronjobs, SSH, cPanel menu tasks and etc.
Both of the examples above have the button “Details” You can use it to check the current usage. It looks like this:
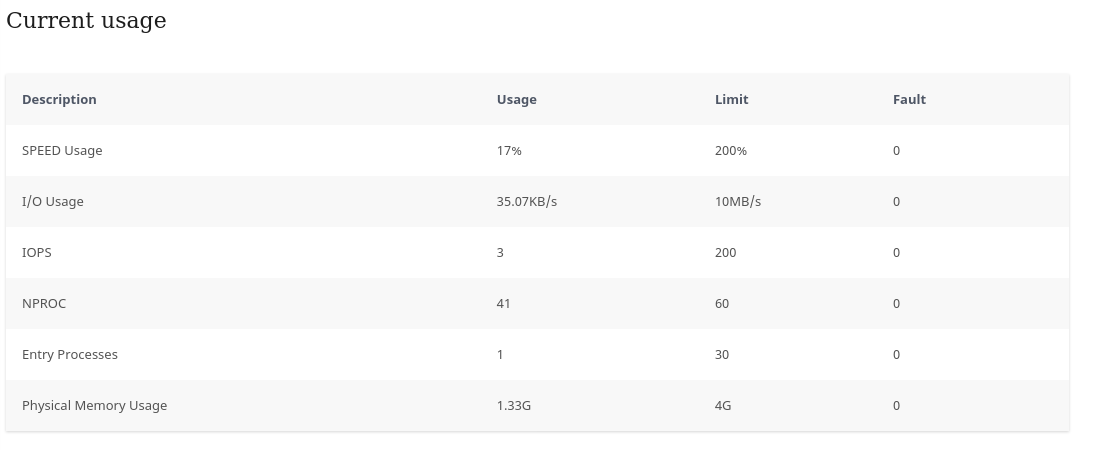
This is a quite simple and self-explanatory example. The view shows your current usage and account limits. Also, faults if there are any.
- Fault is just a single case of exceeding one of the account’s limits: I/O, EP, NoP, CPU, Pmem, and others you see in the picture above.
If you see any faults, there is a great chance your website is working incorrectly. Perhaps a specific part of your website generates a loop, incorrect requests that can’t be completed within the given time(limited by max_execution_time).
If you scroll down the same menu “Current Usage”, you will see some historic data of your resource usage, which can also help to determine if the situation is now, or recurring for some time.
The Resource Usage menu has another interesting feature – Snapshot. This feature periodically saves the list of processes that were active at a certain time. You can choose the date and time of the snapshot and review what process ran on your account and how much CPU and/or Memory it took. The example looks like this:
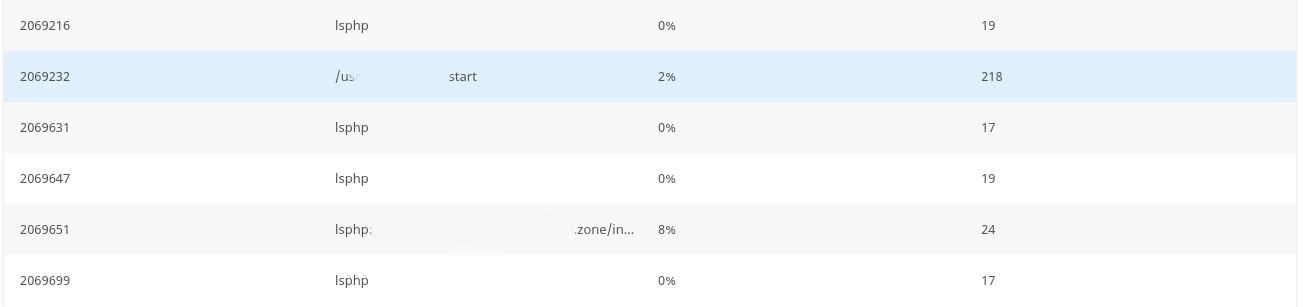
The information on the view is simple to read as well:
- PID – The process ID.
- CMD – The command or script that runs
- CPU – The CPU usage for the specific process
- MEM – The amount of memory used by the specific process
The processes can be killed via the Terminal option on cPanel with the following command:
kill process_id
You can access the user terminal on the cPanel > Terminal menu.
This should help to troubleshoot website issues and give you an insight into where to look, and perhaps mitigate the issue if you see it ongoing at the time of your check.